
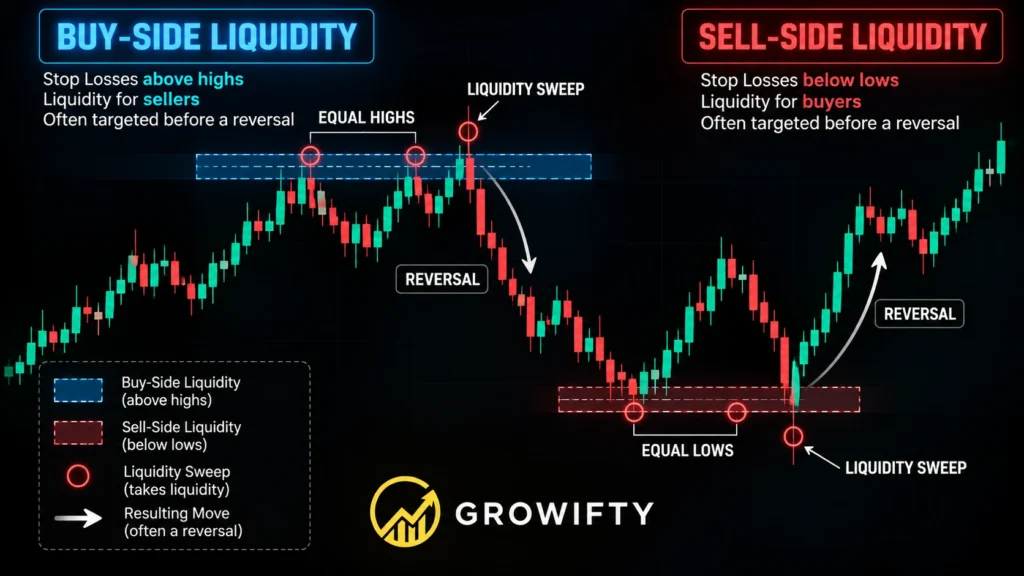
Price does not move randomly from one level to another.
Behind every significant market move are buyers, sellers, pending orders, stop-losses, and traders waiting to enter or exit positions.
Together, these orders create liquidity.
Understanding where liquidity is likely to be concentrated can help traders better understand why price moves toward certain levels, why breakouts sometimes fail, and why the market often reverses shortly after taking an obvious high or low.
In Smart Money Concepts (SMC), liquidity is therefore an important part of reading market behavior.
Key idea: Liquidity represents areas where a large number of orders may be available for execution.
What Is Liquidity in Trading?
In financial markets, liquidity generally describes how easily an asset can be bought or sold without causing a significant change in price.
But when traders discuss liquidity within Smart Money Concepts, they often focus on something more specific:
areas on the chart where clusters of orders are likely to exist.
These can include:
- Stop-loss orders
- Breakout orders
- Limit orders
- Orders positioned around previous highs and lows
- Orders around obvious support and resistance levels
These concentrations of orders can create areas that attract price.
This is why price frequently moves toward obvious highs or lows before making its next significant move.
Why Does the Market Seek Liquidity?
Large market participants cannot always enter or exit substantial positions at a single price without sufficient opposing orders.
They need liquidity.
Areas containing many orders can therefore become important locations for market activity.
Imagine that price is approaching a previous major high.
Above that high may be:
- Stop-losses from short positions
- Buy-stop orders from breakout traders
- New traders waiting to buy the breakout
That creates a concentration of potential buy orders.
Price may trade above the high, trigger those orders and then either:
continue higher
or
reject the level and reverse.
This is why understanding liquidity is more useful than simply assuming:
“Price broke resistance, so it must continue higher.”
The reaction after liquidity is taken matters.
Buy-Side Liquidity (BSL)
Buy-Side Liquidity is commonly found above significant highs.
These areas may contain:
- Stop-losses from short sellers
- Buy-stop orders
- Breakout entries
Common locations include:
Previous Highs
Equal Highs (EQH)
Range Highs
Major Swing Highs
Obvious Resistance Levels
In simple terms:
Buy-Side Liquidity = liquidity resting above market highs.
Real Chart Example #1 — Buy-Side Liquidity
Now let’s look at how Buy-Side Liquidity appears on a real chart.
📊 TRADINGVIEW SCREENSHOT #1
[
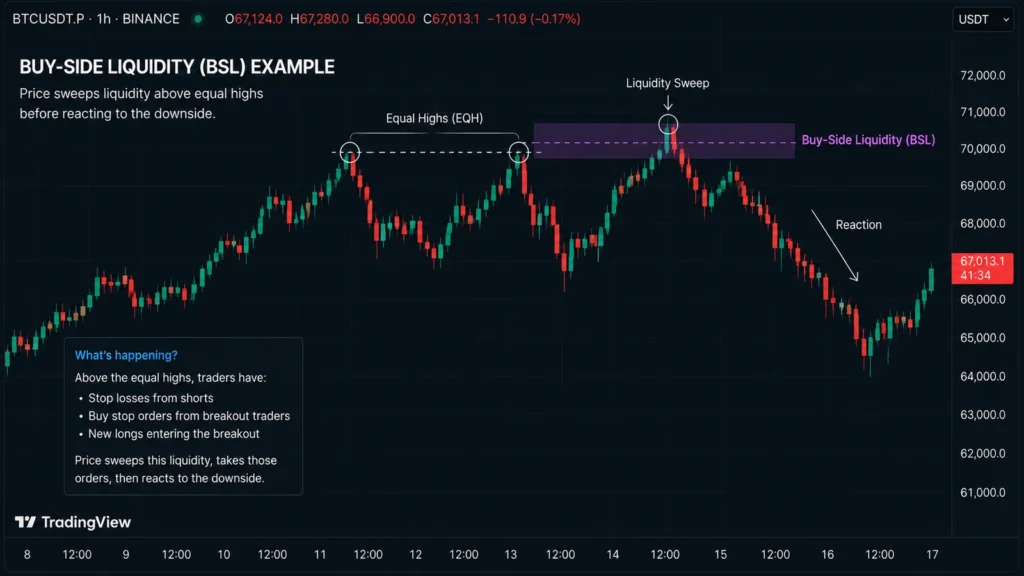
Mark on the chart:
- Previous High / Equal Highs
- Buy-Side Liquidity (BSL)
- Liquidity level above the highs
- Price move into liquidity
- Liquidity sweep
- Reaction after the sweep
A clean example could look like:
Equal Highs → Buy-Side Liquidity → Sweep Above Highs → Rejection
Suggested caption:
Buy-Side Liquidity example: price trades above previous highs where stop-losses and breakout orders may be concentrated before reacting from the area.
What Happened?
The important part isn’t simply that price moved above the previous high.
The important question is:
What happened after liquidity was taken?
If price trades above the high and continues strongly upward, the breakout may represent genuine continuation.
But if price quickly rejects the level and returns below the previous high, the move may represent a liquidity sweep.
This distinction is critical.
Sell-Side Liquidity (SSL)
Sell-Side Liquidity is commonly found below significant lows.
These areas may contain:
- Stop-losses from long positions
- Sell-stop orders
- Breakdown entries
Common locations include:
Previous Lows
Equal Lows (EQL)
Range Lows
Major Swing Lows
Obvious Support Levels
In simple terms:
Sell-Side Liquidity = liquidity resting below market lows.
Real Chart Example #2 — Sell-Side Liquidity
Now let’s look at the opposite situation.
📊 TRADINGVIEW SCRE
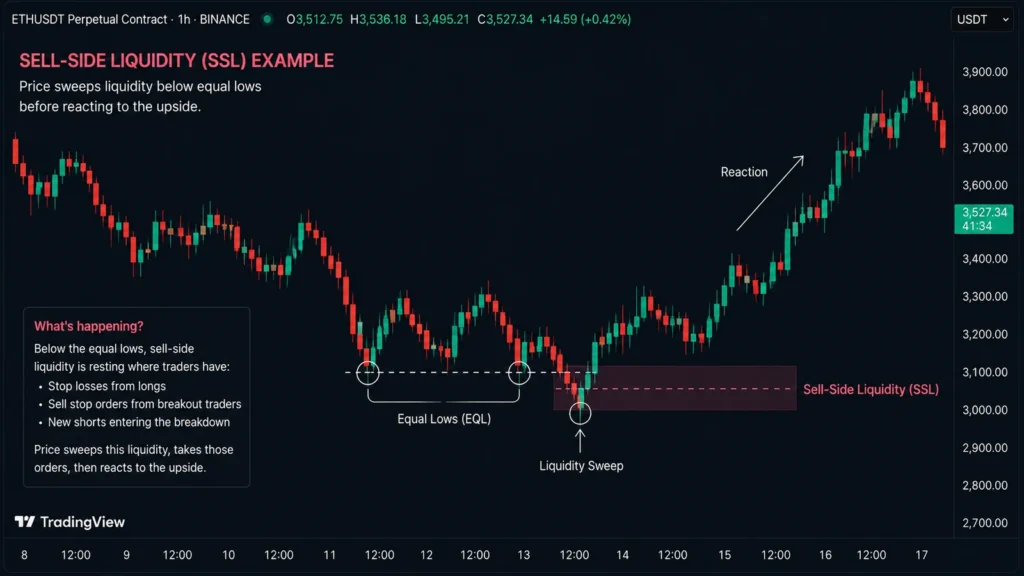
Mark on the chart:
- Previous Low / Equal Lows
- Sell-Side Liquidity (SSL)
- Liquidity level below the lows
- Price move into liquidity
- Liquidity sweep
- Reaction after the sweep
A clean example could look like:
Equal Lows → Sell-Side Liquidity → Sweep Below Lows → Reversal
Suggested caption:
Sell-Side Liquidity example: price trades below previous lows where stop-losses and sell orders may be concentrated before reacting from the area.
What Is a Liquidity Sweep?
A liquidity sweep occurs when price trades through an area where liquidity is expected to be concentrated and then reacts.
For example:
Price forms two similar highs.
Many traders identify those highs as resistance.
Short sellers may place their stop-losses slightly above them.
Breakout traders may place buy orders above the same level.
Price then moves above those highs.
Orders are triggered.
But instead of continuing higher, price quickly reverses.
That move is commonly described as a:
Buy-Side Liquidity Sweep
The opposite can happen below lows:
Sell-Side Liquidity Sweep
Liquidity Sweep vs Breakout
This is one of the most important distinctions when studying liquidity.
Breakout
Price breaks an important level and continues moving in the direction of the break.
For example:
Resistance → Break → Acceptance Above → Continuation
Liquidity Sweep
Price temporarily trades beyond an important level, takes liquidity and then returns back through the level.
For example:
Previous High → Sweep Above → Rejection → Move Lower
Therefore:
A break tells you where price went. The reaction tells you what the break meant.
Liquidity and Market Structure
Liquidity becomes much more useful when combined with market structure.
Suppose the market is in an uptrend:
HL → HH → HL → HH
Above the previous HH may sit Buy-Side Liquidity.
Price trades above that high and takes liquidity.
What happens next?
If buyers remain strong and price continues upward, bullish structure may remain intact.
But if price sweeps the high, rejects strongly and later breaks an important Higher Low, the situation becomes much more interesting.
You may now have:
Buy-Side Liquidity Sweep → Bearish CHOCH
This combines two different pieces of information:
Liquidity tells us where orders may have been taken.
CHOCH tells us that market structure may now be changing.
Liquidity + CHOCH Example
Consider this sequence:
1. Market forms an uptrend
HH → HL → HH
2. Price approaches the previous high
Buy-Side Liquidity may exist above it.
3. Price trades above the high
Liquidity is taken.
4. Price rejects the level
Buyers fail to maintain the breakout.
5. Price breaks the previous structural HL
A Bearish CHOCH may now be forming.
The liquidity sweep alone wasn’t necessarily enough.
The structural change provides additional information.
Continue learning:
If you haven’t studied CHOCH yet, read:
Change of Character (CHOCH) Explained
Liquidity + BOS
Liquidity can also appear before continuation.
Imagine a bullish market approaches previous highs.
Price briefly takes liquidity, pulls back, but bullish structure remains intact.
The market then breaks another important high.
This could produce:
Liquidity interaction → continuation → Bullish BOS
That’s why liquidity should never automatically be interpreted as a reversal signal.
The market still needs to show what happens after liquidity is taken.
Continue learning:
Break of Structure (BOS) Explained
Equal Highs and Equal Lows
Equal Highs and Equal Lows are particularly interesting when studying liquidity.
Equal Highs (EQH)
When price repeatedly reaches approximately the same high, traders may see resistance.
Above those highs can accumulate:
- Short stop-losses
- Breakout buy orders
This can create Buy-Side Liquidity.
Equal Lows (EQL)
When price repeatedly reaches approximately the same low, traders may see support.
Below those lows can accumulate:
- Long stop-losses
- Breakdown sell orders
This can create Sell-Side Liquidity.
These areas can become important levels to monitor.
But remember:
Equal highs do not guarantee price will reverse.
Equal lows do not guarantee price will rally.
They simply highlight areas where liquidity may be concentrated.
Internal vs External Liquidity
As you become more comfortable with liquidity, you’ll often hear traders distinguish between internal and external liquidity.
External Liquidity
External liquidity generally refers to liquidity located beyond important structural extremes.
Examples:
- Above major swing highs
- Below major swing lows
- Above range highs
- Below range lows
These are often obvious liquidity targets.
Internal Liquidity
Internal liquidity exists inside the current trading range or market structure.
This can include smaller swing points and other areas where orders may be concentrated before price reaches larger external targets.
For beginners, however, don’t overcomplicate this.
Start by learning to identify:
Major Highs
Major Lows
Equal Highs
Equal Lows
Then study how price reacts around them.
⚠️ Common Liquidity Mistakes
1. Assuming Every High or Low Will Be Swept
Liquidity is a framework for understanding price behavior — not a guarantee that every visible level must be taken.
2. Entering Before Liquidity Is Taken
Seeing Equal Highs doesn’t automatically mean:
“Short here.”
Price may continue significantly higher.
Wait for evidence.
3. Treating Every Wick as a Liquidity Sweep
Context matters.
A wick beyond a level does not automatically create a high-quality trading setup.
Study what price does afterward.
4. Ignoring Market Structure
Liquidity without structure can quickly become confusing.
Combine liquidity with:
HH / HL / LH / LL
BOS
CHOCH
and broader market context.
5. Trying to Predict Institutional Orders
You cannot see every participant’s intention simply by looking at a chart.
Treat liquidity concepts as a framework for interpreting price behavior, not as proof that you know exactly what a bank, hedge fund, market maker, or institution is doing.
This distinction matters.
How to Identify Liquidity on a Chart
Start simple.
Step 1 — Identify the Market Structure
Is the market:
Bullish?
Bearish?
Ranging?
Step 2 — Mark Significant Highs and Lows
Ignore insignificant market noise.
Focus on clear structural levels.
Step 3 — Look for Obvious Liquidity Areas
Pay particular attention to:
Equal Highs
Equal Lows
Previous Swing Highs
Previous Swing Lows
Range Highs and Lows
Step 4 — Wait for Price to Reach the Area
Don’t predict the reaction.
Observe it.
Step 5 — Study What Happens Next
Ask:
Did price continue?
Did it reject?
Was structure broken?
Did CHOCH occur?
Did BOS confirm continuation?
This is where liquidity becomes part of a complete trading framework rather than a standalone signal.
Practice Identifying Liquidity on Real Charts
The fastest way to understand liquidity is to study it on real charts.
Choose one market and begin marking:
Buy-Side Liquidity
Sell-Side Liquidity
Equal Highs
Equal Lows
Liquidity Sweeps
Then observe what market structure does after those levels are reached.
I use TradingView to mark structural levels, study price action and review how markets react around potential liquidity areas.
A Simple Liquidity Checklist
Before using liquidity as part of your analysis, ask:
✓ What is the current market structure?
✓ Where are the obvious highs and lows?
✓ Where might orders be concentrated?
✓ Is this Buy-Side or Sell-Side Liquidity?
✓ Has liquidity actually been taken?
✓ How did price react afterward?
✓ Did market structure confirm continuation or change?
✓ Does the setup fit my risk management rules?
The more clearly you can answer these questions, the less likely you are to trade based purely on assumptions.
Final Thought
Liquidity helps explain why obvious highs and lows matter.
But liquidity alone should not determine a trade.
The real value comes from combining:
Liquidity + Market Structure + Confirmation + Risk Management
Instead of asking:
“Where will price go?”
start asking:
“Where is liquidity likely to exist — and what does price do when it gets there?”
That shift in thinking can make market behavior much easier to understand.
GROWIFTY
Trade with structure. Grow every day.
Educational content only. Nothing in this article constitutes financial or investment advice.